EE案例 | Filter Design solution 这是一个来自EE案例 | Filter Design | 电路设计案例 | SPICE KNE488 RF|的解决方案。
UNIVERSITY OF TASMANIA SCHOOL ENGINEERING
KNE488 RF project (12.5%)
Due in Week 13
Filter Design
Design/Derive (determine the element values) for a N = 2 element equal-ripple filter if the ripple specification is 1.0dB. Do not use tables! Start with the definition of the power loss ratio. Prototype values only are required.
公式省略….
With=1, the power loss ratio for the equal ripple filter is: ()
For the 2-element filter with -1, we set up:
1 +
Which can be solved for R, L and C if the ripple level is knows. Thus, at w = 0, we have that:
As we know, the ripple specification in the question is 1.0 db, the value of k can be derived as:
– 1
0.5088
8
As we know,
According to the equation above, we can derive the value:
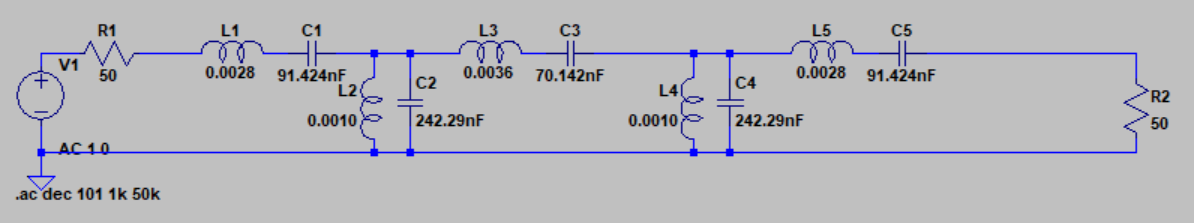
Determine the values of the reactive components (inductances and capacitances) for a 5th order 3dB bandpass Chebycheff filter with load and source impedances of 50Ω. The bandwidth is to be 4kHz, in this case, between 8kHz and 12kHz.
Low pass prototype:
N g1 g2 g3 g4 g5 g6
5 3.4817 0.7618 4.5381 0.7618 3.4817 1.0000
L1 C2 L3 C4 L5 RL
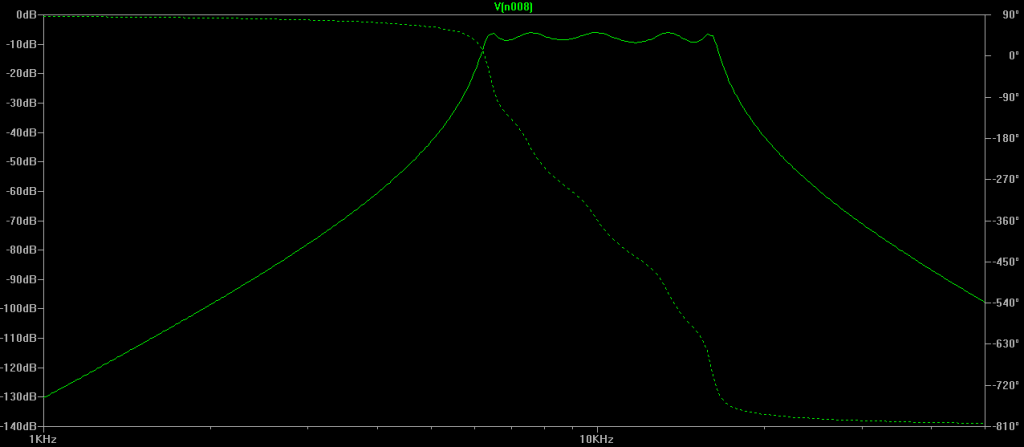
Plot the frequency response (amplitude and phase) of question 2.
The frequency response of the bandpass filter can be seen in the figure below. The center frequency is set as 10 KHz and the bandwidth is 4 KHz. The corresponding spice circuit diagram is displayed as follow. The element values are derived in Question 2.
EE案例 | Filter Design
Determine the values of the reactive components (inductances and capacitances) for a 5th order low-pass-prototype with source and load terminations of 1 ohm for the following 3 cases:
Butterworth characteristic.
N g1 g2 g3 g4 g5 g6
5 0.6180 1.6180 2.0000 1.6180 0.6180 1.0000
Chebycheff 3dB characteristic.
N g1 g2 g3 g4 g5 g6
5 3.4817 0.7618 4.5381 0.7618 3.4817 1.0000
Bessel characteristic.
N g1 g2 g3 g4 g5 g6
5 0.9303 0.4577 0.3312 0.2090 0.0718 1.0000
Plot the frequency response of the 3 filters of Question 4 on a suitable frequency scale and compare and briefly discuss the different frequency responses.
The comparison of frequency response between the three filters can be seen in the figure above.
For the Butterworth filter, the frequency response curve in passband is as flat as possible without ripples, while it gradually drops to zero in stopband. Compared with the Butterworth filter, Chebycheff filter attenuates faster in transition band, but the amplitude-frequency characteristic of frequency response is not as flat as. Bessel filter has the flattest amplitude and phase response. The phase response of bandpass is nearly linear
In the discussion, you may consider the following points:
The Bessel filter values decrease monotonically, why?
Bessel Filters are usually referred to as Linear Phase filters, which are modified for equiripple group delay. The conventional linear filter is based on RC circuit, where the relationship between phase and frequency can be seen in the figure below. That’s why, in the passband, the filter values always decrease monotonically (linearly).
Compare the cutoff rates, phase responses and pass band attenuations between the filters.
The Chebycheff response can provide the sharpest cutoff, while it has the worst group delay characteristics. The error between the frequency response curve of Chebyshev filter and ideal filter is the smallest, but there is amplitude fluctuation in passband.
The Butterworth filter has a flatter attenuation characteristic in the passband with a lower cutoff rate. The Bessel is kind of linear phase filter with a maximally linearly phase response. This filter has the worst cutoff rate, However it presents a very good group delay characteristic.
To compare the filters, you should normalize the attenuation magnitude to zero dB. State how this is done in the simulation and ensure that this is done for any comparison plots.
According to the power lose equation. Make sure when the w=0, there are no any power lose.
SPICE is a suitable tool for simulating the various filters.